


Bandung, UPI
Corona Virus Disease (COVID-19) is a new type of virus that was first discovered in the human body in Wuhan City, Hubei Province, China in 2019. However, until now the development has been so extraordinary that it reached Indonesia. In Indonesia, up to 1,200 cases have been recorded with more than 120 people died. This means it has a mortality rate of around 10%. One of the causes of the massive spread of this virus is physical contact from one infected person to another. From this problem, the government finally imposed physical distancing and even some of the regional leaders imposed regional quarantine. This policy is an effort to stop the spread of this virus.
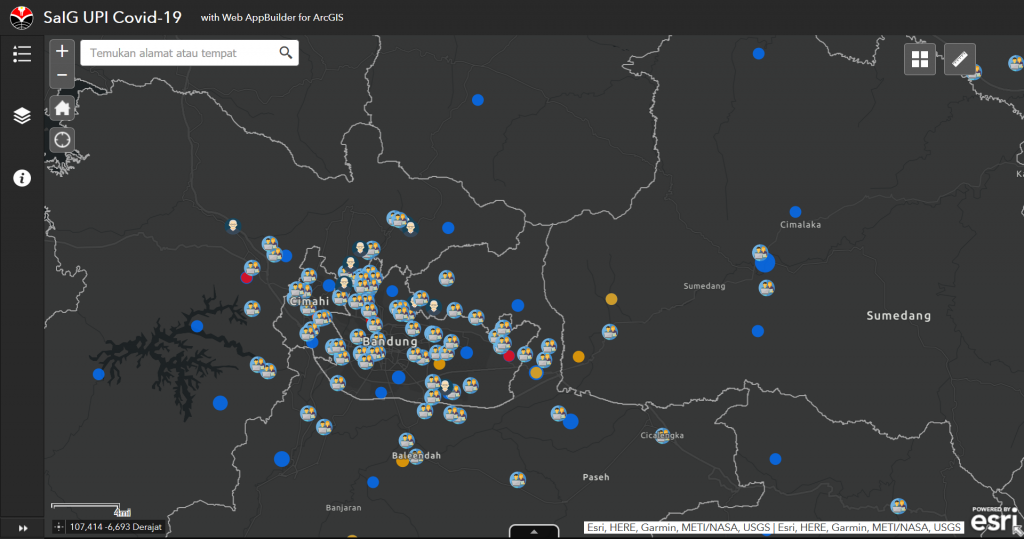
To contribute to this pandemic situation Geographic Information Science (SaIG) students, Faculty of Social Sciences Education (FPIPS), Indonesian Education University (UPI) made a COVID-19 distribution map. This map was made based on WebGIS with ESRI support. WebGIS is a Geographic Information System (GIS) application that can be reached online via the internet. In the WebGIS configuration, there is a server tasked with being a MapServer that processes map requests from the user/client and then sends them back to the client. In this case, the client does not need to have GIS software. Simply by using a browser (browser) such as Internet Explorer, Edge, Mozilla Firefox, Safari or Google Chrome to access GIS information that is on the server.

This COVID-19 distribution map by SaIG was compiled by several students from the class of 2018 namely, Iqbal Eko Noviandi (@iqbaal.eko), Muhammad Arrafi (@mhmmdarrafi), and Agil A. Fahrezy (@agilfahrezy11). Currently, WebGIS can be accessed via the link http://bit.ly/PETAUPICOVID19.
“Distribution data obtained for the level of accuracy varies, especially for West Java. The level of distribution accuracy is at the subdistrict level, for Central Java and DKI Jakarta, Banten and Lampung, the distribution accuracy is at the district/city level. This is due to differences in data sources per region available on the internet. Also, data on the spread of this virus cannot be visualized accurately because all predictions have a percentage of accuracy in reality that varies depending on the model designed “. The compilers of this distribution map keep reminding us to always be vigilant.

Besides compiling the distribution map, they also made a form that would show our position and condition regarding the location of the spread of the COVID-19 outbreak. This data can also be used to determine the level of vulnerability as well as the percentage of UPI Academic Community who are in the safe, alert and hazard category related to the location of the spread of the COVID-19 outbreak in West Java in the form of WebGIS. You can access it through http://bit.ly/UPICOVID19. All data will continue to be updated through the Instagram Geography Information Science account at @saigupi. For more information, you can contact the number 0853-1529-1929. Hopefully with this innovation, all of us, especially the UPI Academic Community in West Java can be increasingly alert to face this pandemic. (JN)